

AI software that helps cardiologists make quicker and more accurate decisions has been rolled out at King’s College Hospital.
ASGCT Honors Mohamed Abou‑el‑Enein as Outstanding New Investigator
Some scientists build tools. Others build bridges. Mohamed Abou‑el‑Enein, MD, PhD, does both—engineering a high‑dimensional platform that temporally maps CAR T cells, while constructing the translational infrastructure needed to move them from concept to clinic. That dual lens has now earned him two of the American Society of Gene and Cell Therapy’s (ASGCT) top honors: the 2026 Outstanding New Investigator Award and, to his lab, the Best of Molecular Therapy Award, which features the contributions of leading early-career authors to the Molecular Therapy family of journals.
This year’s Molecular Therapy recognition highlights a study from Abou‑el‑Enein’s lab, published in May 2025, that uses spectral flow cytometry to map how CAR T cells remodel during manufacturing, revealing a five‑day window when the cells are most potent. The work reflects a core principle of his group: you cannot rationally engineer what you cannot precisely measure. Their high‑dimensional analytical tools are designed to simultaneously capture the full profile of each engineered cell, information that directly shapes how next‑generation therapies are built.
“Spending my career bridging scientific discovery and patient care, both by supporting others and through our own research, makes this dual recognition especially meaningful,” said Abou‑el‑Enein. “The contribution of translational scientists has long been underestimated and under‑acknowledged, and having a committee of peers recognize its value means a great deal to me.”
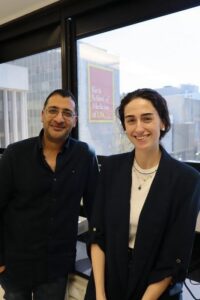
As a physician‑scientist, Abou‑el‑Enein brings comprehensive training to the problems of cell and gene therapy translation, a trajectory shaped across leading institutions globally. His path spans clinical medicine, regulatory science, biomanufacturing, and data science—training that now converges at the University of Southern California (USC), where he leads the USC/Children’s Hospital Los Angeles Cell Therapy Program and directs the institution’s cGMP manufacturing facility. His team has built a platform capable of producing a wide range of advanced therapies, from viral vectors to stem‑cell–based products. As USC’s Chuck Murry, MD, PhD, director of the Eli and Edythe Broad Center for Regenerative Medicine and Stem Cell Research noted, he brings “an eclectic mix of cell biology, biomanufacturing, and patient‑centered humanity” to the role.
The Abou‑el‑Enein lab extends that mission by developing computational platforms that unify analytical data with predictive modeling. Their newest effort—UNICORN (UNIfying Cell Therapy Outcome prediction and Regulatory Navigation)—integrates high‑dimensional analytics with machine learning to forecast therapeutic performance and streamline regulatory decision‑making for pediatric cancers and rare diseases. It’s a natural evolution of the group’s earlier work, which established a powerful analytical framework for tracking CAR T cell states over time.
Their broader analytical ecosystem includes tools for single‑cell characterization, computational modeling, and non‑viral precision genome engineering, all designed to support translation from the earliest stages of design.
As he prepares to deliver his Outstanding New Investigator lecture in Boston, Abou‑el‑Enein said the meeting is a chance to reconnect with the community that shaped his translational philosophy.
“These awards are catalysts that give me motivation to keep going,” he said. “I always remind my team… we do science because we believe that what we do will make a difference. It’s really about helping patients and making sure they have a real chance.”
The post ASGCT Honors Mohamed Abou‑el‑Enein as Outstanding New Investigator appeared first on GEN – Genetic Engineering and Biotechnology News.
App helps more than 260 cardiac arrest witnesses in Essex
An Essex support service, which includes an app, has helped more than 260 bystanders who saw over 200 out of hospital cardiac arrests (OHCA).
Computer-based tree drawing test in adolescents and adults with depression
ObjectiveTo evaluate the value of the computer-based Tree Drawing Test in the auxiliary diagnosis of depressive disorders and to analyze the differences in the performance of adolescent and adult depression patients in the Tree Drawing Projection Test.MethodsThis study was conducted at Guo Yang County People’s Hospital in Anhui, China, and involved a total of 184 participants: 43 adults with depression, 82 adolescents with depression, and 59 healthy controls. The Tree Drawing Test and scale assessments were administered to patients with depressive disorders (adult group and adolescent group) and a control group. Computer image recognition and calculation techniques were used to analyze the results statistically.ResultsSignificant differences were observed between the adult depression group and the control group in terms of crown area, trunk area, total area, and HDRS scores (p < 0.001). Statistically significant differences were also found between the adult depression group and the adolescent depression group in terms of trunk area (p < 0.01), total area (p < 0.001), HDRS scores (p < 0.001), and HAMA scores (p < 0.01). The crown area (r = -0.261, p < 0.001), trunk area (r = -0.154, p = 0.037), total area (r = -0.285, p < 0.001), and HDRS scores in the Tree Drawing Test were significantly correlated.ConclusionThe computer-based Tree Drawing Test has certain value in the auxiliary diagnosis of depression. Future research should include larger sample sizes and participants from different regions and cultural backgrounds to further validate the generalizability and cultural adaptability of the Tree Drawing Test for depression assessment.
Midlands hospital uses endoscopy tech to examine small bowel
University Hospitals Birmingham NHS Foundation Trust (UHB) has begun using capsule endoscopy technology to examine the small bowel.
Hospital shootings steadily increased since 2000
Get your daily dose of health and medicine every weekday with STAT’s free newsletter Morning Rounds. Sign up here.
Good morning. I was charmed by this profile of tween life in America, both as a former tween girl and as a reporter. I laughed out loud at one tween asking her friend, the main subject of the story: “You’re still getting interviewed?”
[Articles] Who receives psychiatry-focused pharmacogenomic testing, and is it associated with prescribing patterns and acute care utilisation in depression? Real-world evidence from a large health system
In routine clinical practice, PGx testing is preferentially used in youth and adults with clinically complex histories and is associated with shifts in antidepressant prescribing patterns. Exploratory findings suggest hypothesis-generating signals of reduced psychiatric ED utilisation among patients with higher psychiatric complexity, which requires further confirmation. Observed racial disparities highlight the need for earlier and more equitable implementation. Prospective studies incorporating symptom-level and safety outcomes are needed to determine whether PGx-guided prescribing translates into meaningful clinical benefit.
STAT+: Oregon hospitals won’t outsource to national physician chain after all
After a tidal wave of blowback that culminated in a lawsuit, a nonprofit health system has reversed course in its plan to replace its Oregon emergency physicians with a national chain.
PeaceHealth’s announcement Wednesday didn’t disclose what prompted its change of heart, but those familiar with the situation say it’s because the health system’s plan was poised for defeat in a legal challenge. When PeaceHealth said in February it was cutting ties with Eugene Emergency Physicians, the local group that had staffed its Oregon hospitals for 35 years, the news drew tremendous pushback from doctors, nurses, lawmakers, mayors, and emergency medicine groups.
Then, on March 20, the Eugene emergency physicians sued, arguing that PeaceHealth’s plan to use the Atlanta-based staffing chain ApolloMD violated a new Oregon law prohibiting managed service organizations from directly owning medical practices or interfering with clinical decisions. The case has had four hearings, in which the judge was “quite clear” that the scheme violated the law, Senate Bill 951, said Hayden Rooke-Ley, an attorney who represented the doctors and a senior fellow for health care with the American Economic Liberties Project.
Mayo Clinic’s REDMOD AI Doubles Early Detection Sensitivity in Pancreatic Cancer
Pancreatic ductal adenocarcinoma (PDAC) remains one of the deadliest malignancies, with five-year survival rates below 15% and more than 85% of patients diagnosed only after the disease has metastasized. The absence of reliable early detection strategies is a primary barrier to improving outcomes. Conventional imaging, including standard abdominal CT scans, typically fails to identify PDAC during its preclinical, “visually occult” stage, when curative intervention is still possible.
To address this detection gap, a team of researchers at Mayo Clinic, led by radiologist and nuclear medicine specialist Ajit Goenka, MD, has developed and validated a radiomics-based artificial intelligence model called REDMOD (Radiomics-based Early Detection Model), which can detect subtle imaging signatures of PDAC before tumors are visible. By analyzing quantitative texture and structural features embedded within routine CT scans, REDMOD identifies early biological changes associated with carcinogenesis. In a multi-institutional validation study reflecting real-world clinical conditions, the model detected 73% of prediagnostic cancers at a median lead time of approximately 16 months—nearly doubling the sensitivity of radiologists manually reviewing the same scans. Notably, detection rates were even higher more than two years prior to diagnosis, pointing toward REDMOD’s potential for make much earlier interventions possible.
REDMOD’s automated pipeline integrates advanced radiomic feature engineering, including wavelet-based analysis, and an ensemble classification approach trained to handle the low-prevalence nature of early detection. Its longitudinal stability and consistent performance across diverse imaging systems could help spur its eventual clinical adoption.
Importantly, REDMOD is designed to operate on CT scans already acquired in routine care, particularly in high-risk populations such as individuals with new-onset diabetes. This raises the possibility of embedding AI-driven risk assessment directly into existing clinical workflows, enabling opportunistic screening without additional imaging burden. If validated prospectively, such as in the ongoing AI-PACED trial, REDMOD could shift the paradigm from late-stage diagnosis to proactive detection, potentially increasing the proportion of patients eligible for curative treatment and improving survival in this otherwise lethal disease.
Inside Precision Medicine recently interviewed Goenka to provide an in-depth view of the development of REDMOD, its detection capabilities, and its potential for providing early signals of the development of PDAC.
IPM: Can you walk through how REDMOD was developed, from the initial concept to a fully automated system, and what key technical breakthroughs enabled it to detect pancreatic cancer before tumors are visible?
Goenka: The origin of REDMOD traces back to a question we asked several years ago: if pancreatic cancer is almost always lethal because we find it too late, is there information already sitting in routine computed tomography (CT) scans that we are failing to extract? We published a proof-of-concept in Gastroenterology in 2022 showing that radiomic features from the pancreas could distinguish prediagnostic CTs from controls with high accuracy. But that first-generation model had real limitations. It relied on manual pancreas segmentation, which is labor-intensive and introduces variability. It was tested at a 1:1 case-to-control ratio, which does not reflect the rarity of pancreatic cancer in any realistic screening scenario. And it used a standard classifier without mechanisms to handle severe class imbalance.
REDMOD was built to systematically address each of those barriers. The first breakthrough was automating the front end of the pipeline. We developed and validated a fully automated volumetric pancreas segmentation model based on the three-dimensional (3D) nnU-Net architecture, published separately, which removes the human bottleneck entirely. That made the system scalable; you can run it on thousands of scans without a radiologist drawing a single contour.
The second breakthrough was in feature engineering. We extracted 968 quantitative radiomic features from each segmented pancreas, then applied multi-scale image filtering using wavelet transforms and Laplacian-of-Gaussian (LoG) filters. The wavelet decomposition breaks the image into eight directional sub-bands at different spatial frequencies, allowing the model to detect textural patterns at scales that the human eye cannot resolve. We then used the Minimum Redundancy Maximum Relevance (mRMR) algorithm to distill those 968 features down to 40 that carried the most predictive information. What emerged was striking: 90% of the selected features were filter-derived, meaning the signal lives in the texture of the tissue, not in anything visible on the standard grayscale image.
The third breakthrough was the ensemble classifier. Rather than relying on a single algorithm, REDMOD combines logistic regression, random forest, and extreme gradient boosting (XGBoost) through a soft-voting mechanism. Each algorithm processes the same 40 features; their probabilistic outputs are averaged to produce the final classification. This architecture achieved the highest sensitivity among all configurations we tested, 73%, which matters enormously in a disease where missing a case is effectively a death sentence. The entire system was trained using Synthetic Minority Over-sampling Technique (SMOTE) to handle the class imbalance inherent in early detection, and validated on an independent test set with a roughly 7:1 control-to-case ratio that approximates real-world prevalence in high-risk cohorts.
The fourth breakthrough, and one that distinguishes REDMOD from models that produce a simple binary output, is the pliability of the operating threshold. REDMOD generates a continuous probability score from zero to one. We used the Youden Index to define a statistically optimized default threshold (0.41), but this threshold can be adjusted to match different clinical objectives without retraining the model. In a non-invasive triage setting, the threshold can be lowered to maximize sensitivity, catching as many cancers as possible even at the cost of more false positives. When the clinical pathway moves toward invasive procedures such as biopsy, the threshold can be raised to prioritize specificity and precision, reducing the risk of subjecting healthy patients to unnecessary procedures. This tunability means that a single trained model can serve multiple roles across the clinical cascade, from initial risk stratification through confirmatory workup.
IPM: The model relies heavily on radiomic features, particularly wavelet-filtered textures. What do these features capture biologically, and why are they better suited to detecting early pancreatic cancer than conventional imaging markers?
Goenka: Conventional imaging markers for pancreatic cancer, such as a visible mass, ductal dilation, or vascular involvement, are late manifestations. By the time you see them, the disease has typically been present for years. What we needed was a way to detect the biological processes that precede mass formation.
Radiomic texture features quantify the spatial relationships between voxels, which are the three-dimensional equivalent of pixels. They measure how intensity values co-occur, how they cluster, and how uniform or heterogeneous the tissue appears at different scales. Specifically, features derived from the Gray-Level Co-occurrence Matrix (GLCM) measure local patterns of intensity variation; Gray-Level Size Zone Matrix (GLSZM) features capture the distribution of connected regions of similar intensity; and Gray-Level Dependence Matrix (GLDM) features quantify how dependent each voxel’s value is on its neighbors. These are mathematical descriptions of tissue microarchitecture.
The wavelet filtering is what makes this work in the prediagnostic setting. A wavelet transform decomposes the image into sub-bands that isolate different spatial frequencies and directions. This allows the model to detect textural disruptions across multiple scales: fine-grained changes that might reflect early stromal remodeling or desmoplastic reaction, and coarser patterns that could correspond to alterations in parenchymal organization. When we performed ablation studies, models built from filtered features alone matched the full REDMOD performance (area under the receiver operating characteristic curve [AUC] of 0.82), while models restricted to unfiltered features dropped to 0.74. That 8-point difference was statistically significant and tells us that the prediagnostic signal is fundamentally a multi-scale textural phenomenon.
Biologically, this aligns with what we know about early pancreatic carcinogenesis. Before a mass forms, the tumor microenvironment undergoes extracellular matrix remodeling, fibrotic changes, and shifts in cellular density that alter tissue texture at microscopic scales. These changes are invisible to a radiologist reading the scan on a monitor, but they leave a quantitative fingerprint in the image data. That fingerprint is what REDMOD reads.
IPM: How did you assemble the training dataset, and why was it important to simulate a low-prevalence, real-world screening environment?
Goenka: Assembling the dataset was one of the most labor-intensive aspects of this work, because prediagnostic CT scans are inherently rare. These are scans obtained for unrelated clinical reasons in patients who were later diagnosed with pancreatic cancer, but at the time of the scan, the pancreas appeared entirely normal on radiology review. We identified 219 such patients across the Mayo Clinic enterprise, with scans obtained three to 36 months before histopathologic diagnosis. Each was verified by expert radiologists to confirm the absence of any discernible pancreatic abnormality.
The control cohort comprised 1,243 patients whose CT scans showed a normal pancreas and who remained cancer-free for at least three years of follow-up. That three-year washout period was essential; without it, you risk contaminating the control group with patients who had undetected cancer at the time of their scan.
We then split the full cohort into 969 training cases and 493 test cases, with the test set held completely independent. The resulting control-to-case ratio of approximately 7:1 was a deliberate design choice. Most artificial intelligence (AI) studies in this space have used balanced 1:1 ratios, which inflate performance metrics and do not reflect the reality of early detection. In any high-risk cohort you would screen clinically, for example patients with new-onset diabetes and elevated Enriching New-Onset Diabetes for Pancreatic Cancer (ENDPAC) scores, pancreatic cancer prevalence is roughly 3-4%. If you train and test your model at 1:1, you get numbers that look strong in a paper but collapse when deployed in a real population. We wanted REDMOD’s reported performance to approximate what a clinician would actually experience.
IPM: You validated the model across multiple institutions, imaging systems, and external datasets. What were the biggest challenges in ensuring consistent performance across such heterogeneous data?
Goenka: The central challenge is that CT scans are not standardized. Different hospitals use different scanners from different manufacturers, different acquisition protocols, different reconstruction algorithms, and different contrast timing. All of these affect the pixel-level values that radiomic features depend on. A model that works well on data from one scanner can fail on data from another.
We addressed this at multiple levels. First, our prediagnostic cohort was inherently heterogeneous. 71% of the prediagnostic CTs in the test set were acquired at external institutions, not at Mayo Clinic. These scans came from a range of scanners (Siemens, GE, Toshiba, Philips) and clinical settings. Second, we validated specificity on two independent external cohorts: a multi-institutional dataset drawn from the Mayo Clinic enterprise across multiple campuses, and the National Institutes of Health Pancreas CT (NIH-PCT) dataset, which is a publicly available benchmark that uses entirely different acquisition parameters. REDMOD achieved 87.5% specificity on the NIH-PCT dataset, data the model had never encountered and that was acquired under conditions completely outside our control.
Third, we performed a longitudinal test-retest analysis. For patients with serial CT scans, we assessed whether REDMOD produced consistent predictions across time points. The concordance rate was 90-92%, meaning the model’s output was stable despite natural variations in patient hydration, contrast timing, and physiologic state between scans. That kind of temporal stability is essential for any tool used in a surveillance context, where you need to trust that a change in the model’s output reflects a real biological change, not scanner noise.
IPM: How do you see REDMOD being integrated into existing clinical workflows, for example in evaluating incidental CT scans or screening high-risk groups like patients with new-onset diabetes?
Goenka: The population where this has the most immediate clinical relevance is individuals with glycemically-defined new-onset diabetes (gNOD) and an ENDPAC score of three or higher. This is a well-characterized high-risk group with a 3-4% short-term risk of developing pancreatic cancer, roughly 20 times the general population rate. Many of these patients already receive CT scans for other clinical indications. The question is not whether to scan them; the question is whether we are extracting all the information those scans already contain. We were not. REDMOD changes that.
The workflow we envision is not a population-wide screening program. It is a targeted, risk-stratified approach. An electronic medical record (EMR)-based algorithm identifies patients who meet gNOD and ENDPAC criteria. When those patients undergo a CT scan, either for clinical reasons or as part of a structured surveillance protocol, REDMOD runs in the background, analyzes the pancreas automatically, and generates a risk score. If the score exceeds a defined threshold, it triggers a clinical pathway: the referring physician is notified, and the patient enters a structured workup that could include enhanced imaging, molecular imaging with fibroblast activation protein (FAP)-targeted positron emission tomography (PET) radiotracers, or closer follow-up.
REDMOD does not replace the radiologist. The radiologist reads the scan according to standard practice and generates their clinical report independently. REDMOD operates as a parallel, complementary layer, a second opinion from a system that reads data the human eye cannot access. The physician integrates both sources of information to make clinical decisions.
This is precisely the model we are testing in the AI-PACED (Artificial Intelligence for Pancreatic Cancer Early Detection) prospective clinical trial at Mayo Clinic. In this trial, all CT scans are interpreted by non-study radiologists who are blinded to the study objectives, and their reports enter the patient’s medical record as part of routine clinical care. Independently, the AI analysis is performed on de-identified data on secure research servers. A strict firewall separates the two: AI-generated outputs are not integrated into the EMR, are not communicated to the clinical team, and are not used to guide diagnosis or treatment. This dual-layered design ensures that participants receive the benefit of structured clinical surveillance while allowing a blinded, independent evaluation of the AI’s performance.
IPM: With the AI-PACED prospective trial underway, what are the key questions you still need to answer about clinical utility, false positives, and patient outcomes before this technology can become part of standard care?
Goenka: There are several questions that retrospective data alone cannot answer, and AI-PACED is designed to address them.
The first is lead-time advantage. We know REDMOD detects prediagnostic signal at a median of 475 days before clinical diagnosis in retrospective data. The question is whether that lead time translates into an actual shift in diagnostic timing in a prospective setting, that is, whether patients in a structured AI-augmented surveillance protocol receive their diagnosis earlier, and at a more resectable stage, compared to patients receiving symptom-driven standard care. The trial’s primary endpoint is the time-to-diagnosis from gNOD onset, compared between the interventional and observational cohorts using Kaplan-Meier survival analysis and Cox proportional hazards modeling.
The second is false positives. In the retrospective validation, REDMOD had an 81% specificity, which means approximately 19% of healthy patients received a positive flag. In a low-prevalence screening population, even a modest false positive rate generates a meaningful number of patients who undergo additional workup for a cancer they do not have. AI-PACED will quantify the downstream diagnostic burden, including additional imaging studies, biopsies, and the psychological impact, so we can make an honest assessment of the risk-benefit tradeoff. It is worth noting that REDMOD’s precision of 36.2% at its default operating point already exceeds the 3% precision threshold recommended by the United Kingdom’s National Institute for Health and Care Excellence (NICE) at the first step of cancer referral, and established screening programs for lung and breast cancer accept similar tradeoffs at their initial triage steps.
The third is adherence. This is a surveillance protocol in asymptomatic people. They feel fine. Asking them to return for serial CT scans and blood draws over 12 months requires trust, and that trust has to be earned through transparency about what we know and what we do not know. AI-PACED will measure recruitment yield from EMR-identified high-risk individuals, retention rates across the imaging and biobanking protocol, and the practical challenges of integrating AI into existing radiology workflows without disrupting standard care.
The fourth, and perhaps most important for the long term, is whether earlier detection actually changes outcomes. Stage shift, moving a patient from stage IV to stage I or II, is necessary but not sufficient. We need evidence that patients diagnosed through AI-augmented surveillance live longer, have access to curative surgical resection, and experience better quality of life. That is the bar this technology must clear, and it is the bar we intend to hold ourselves to.
The ongoing phase of AI-PACED is a feasibility study. It is designed to generate the operational, logistical, and preliminary clinical data needed to justify and design a fully powered, multi-institutional trial. In addition, we are running in silico clinical trials and cost-effectiveness analyses. We are building the evidence base one layer at a time, because the stakes, for patients and for the credibility of AI in clinical medicine, are too high to cut corners.
The post Mayo Clinic’s REDMOD AI Doubles Early Detection Sensitivity in Pancreatic Cancer appeared first on Inside Precision Medicine.
Blood Test Reads Cell Spatial Environment to Predict Immunotherapy Response
A new study published in Nature has uncovered a universal map of the tumor microenvironment shared across 17 different cancer types—and, crucially, demonstrated that its features can be detected from a blood test to predict whether patients will respond to immunotherapy.
The work, led by Aaron Newman, PhD, at Stanford University and Aadel Chaudhuri, MD, PhD, of the Mayo Clinic describes nine distinct “spatial ecotypes”—stereotyped communities of immune and structural cells that organize themselves in consistent patterns around tumors, regardless of the cancer type. The researchers then developed an AI-based algorithm capable of inferring the proportions of those ecotypes from circulating tumor DNA in plasma, translating a tissue-level biological map into a minimally invasive liquid biopsy readout.
A universal architecture
The researchers studied more than 100 tumor specimens across 10 cancer types, using their tools to map gene expression patterns across nine cell types at varying locations throughout the tumor. They identified nine distinct spatial ecotypes—neighborhoods roughly the diameter of a human hair—and found that these patterns were conserved across all tumors studied. Some ecotypes clustered at the border between tumor and healthy tissue; others appeared deeper within the tumor mass. Several of the ecotypes correlated with immunotherapy response, pointing to potential clinical utility in guiding treatment decisions.
The central discovery is that tumors are not randomly organized. Across carcinomas of the breast and prostate, melanoma, and more than a dozen other cancer types, the same nine spatial ecosystems appear—each with a distinct cellular composition, gene expression signature, and physical location relative to the tumor mass.
“Cells exist not in isolation, but in little communities or neighborhoods or social networks,” said Newman. “These characteristics were highly stereotypical, highly conserved across different carcinomas and melanomas. Each spatial ecosystem has its own common features that differ from other spatial ecosystems—you can think of them as the parts list that most tumors are made of when we think about the soil that nurtures the cancer cells.” And, each spatial ecotype has its own internal social network—the cellular behaviors, or genetic programs it is carrying out, are influenced by the cells around it.
Chaudhuri, a clinician scientist, offered a grounding analogy. “Whether you’re in Tokyo or Minneapolis or San Francisco, you have a downtown, and as you go farther out, you have Midtown, suburbs, and then rural farmland. That’s how it is for the tumor microenvironment as well—close to the tumor cells, you have spatial ecotypes seven, eight, and nine; go farther away and you have spatial ecotypes one, two, three, and four. That map is consistent across all these different cancer types.”
Predicting immunotherapy response
The clinical implications center on immune checkpoint inhibitors, a class of drugs that has transformed oncology but still fails a significant portion of patients. Analyzing 15 immunotherapy cohorts in tissue, the team identified two spatial ecotypes—SE7 and SE8—characterized by T cells positioned at and within the tumor, associated with a pro-inflammatory, anti-tumor immune response, and strongly linked to immunotherapy benefit. Conversely, a fourth ecotype, SE4, associated with wound-healing biology, was strongly predictive of resistance.
“Higher levels of SE7 and SE8 strongly forecast the patient’s response to immune checkpoint inhibitors,” said Newman. “And conversely, higher levels of SE4 portend a worse outcome—resistance to immune checkpoint inhibitors.”
Those tissue-based findings were then validated in blood. Using a deconvolution algorithm the Newman lab developed—the same class of computational approach used to identify cell-type proportions from bulk sequencing data—the team showed that plasma samples taken before treatment could recapitulate the spatial ecotype signals found in paired tumor biopsies, and that those liquid-biopsy-derived ecotype levels predicted patient outcomes with striking fidelity.
“Without looking at their tumor biopsy, just taking a blood sample, we could determine the levels of the liquid spatial ecotypes from their tumors directly from the blood,” Newman said. “Those levels very strongly predicted their outcomes once they received immunotherapy.”
Beyond the single biopsy
Perhaps the most consequential aspect of the platform is what it enables over time. Today, a patient’s tumor microenvironment can be assessed only at the moment of biopsy—a single, static snapshot that may be compromised by sampling bias and cannot be repeated without invasive procedures.
“There is no existing clinical assay to access these features of the cancer over time,” Newman noted. “For the first time, this gives us those insights.”
The team has already begun longitudinal work, with funded studies planned to track melanoma patients serially through immunotherapy—monitoring how spatial ecotype levels shift on treatment and whether those dynamics outperform existing tools like CT imaging, which can struggle to distinguish true progression from pseudo-progression.
Chaudhuri emphasized the broader paradigm shift. “For years and years, we have been completely tunnel-visioned on malignant tumor cells and their mutations, measuring their mutations as surrogates for MRD and things like that,” he said. “For the first time ever, we’ve opened our eyes and we can look at the tumor microenvironment, which is absolutely critical for precision oncology.”
From lab to clinic
The technology has been licensed to a startup company, Liquid Cell Dx, co-founded by Newman and Chaudhuri, with the goal of developing and validating a clinical-grade assay. The team has already presented blinded clinical validation data at AACR, applying cut points learned from the Nature paper cohort to an entirely independent patient population at a separate institution—without knowledge of outcomes until unblinding.
Active translational programs are now underway in non-small cell lung cancer, muscle-invasive bladder cancer, and mesothelioma, examining spatial ecotypes in the context of chemotherapy combinations, neoadjuvant settings, and radiotherapy.
Newman was recently awarded an AACR Trailblazer Award for the serial monitoring work in melanoma.
“The goal here is for this not to just end at the Nature paper, for it to benefit humanity,” said Chaudhuri. “We want to take the technology, get it into patients, develop it into a clinical assay, and really show that we can bring next-level precision into oncology.”
The post Blood Test Reads Cell Spatial Environment to Predict Immunotherapy Response appeared first on Inside Precision Medicine.